DNS Analytics

Security with DNS Data

Our analytics tools are essential to the safety of your infrastructure. The ability to see your query activity in real-time provides insights that can identify misconfigurations and traffic anomalies (DDoS Attacks). DNS Made Easy's analytics solution is the world's most accurate DNS anomaly detection service available as it allows you to catch attacks before they happen.

Analytics DNS Image

Real-Time Query Analytics

DNS Analytics Map

DNS Analytics allow you to see your domains' query activity as raw data logs or in visual forms such as line and bar charts, interactive maps, and filterable tables.
Quickly identify traffic anomalies such as DDoS attacks
Gather insight into your DNS infrastructure
Pinpoint system misconfigurations
Find stale/unused records
Compare usage trends over time

Domain Management

Data Icon
Account Analytics

Quick overview of your account's query activity. Compare query totals across multiple domains.

lightbulb icon
Domain Analytics

Interactive query reports for individual domains. Dig deeper into influxes in traffic and gather insight into your DNS infrastructure.

query logging icon
Query Logging

Watch your traffic in real time on an interactive map or filterable table. Logs can be saved and reuploaded for historical comparison.

Data Arrow Icon
Real-Time Stats

See which records are being queried the most. Filter historical query data by record type, name, location, or IP version.

DNS Account Analytics

Get a quick overview of recent query activity for all domains in your account.

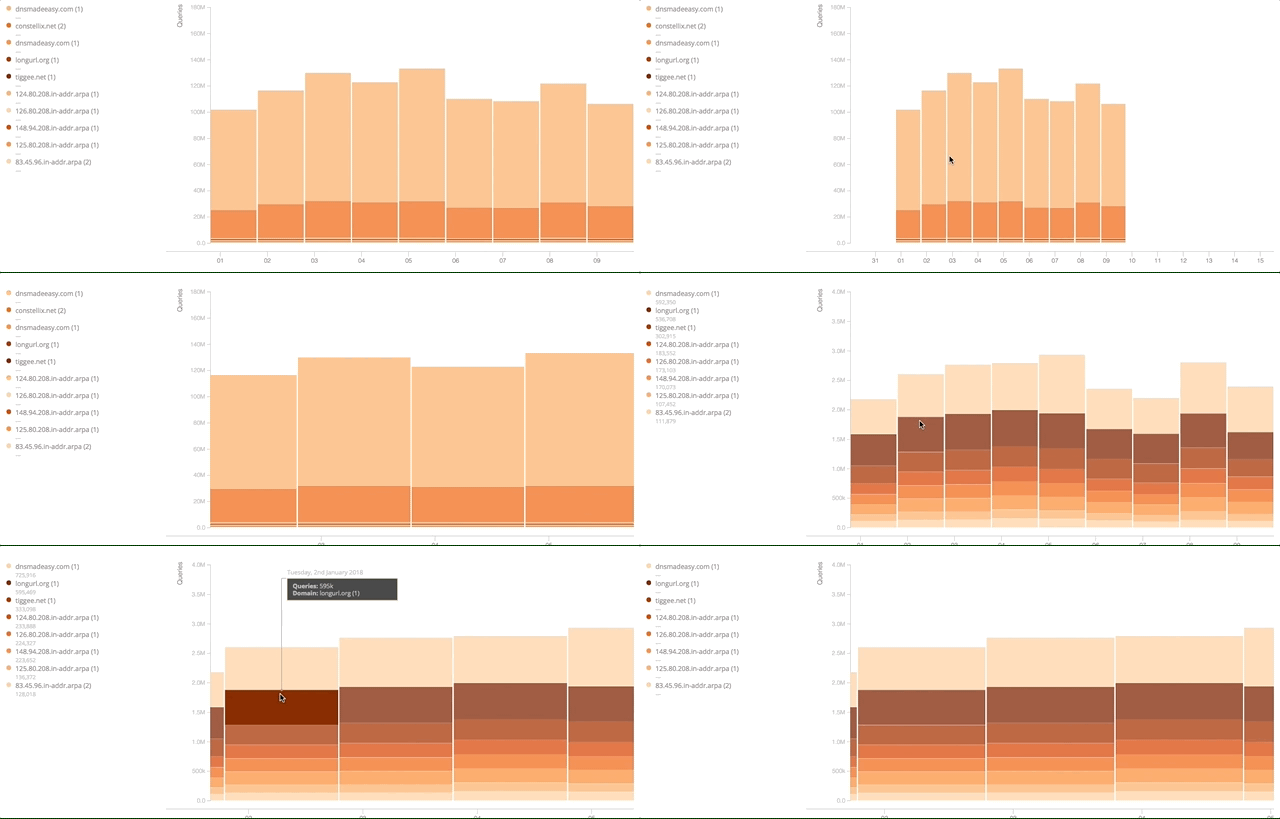
When you first log into DNS Analytics, you will see a bar chart of the daily query counts for the current billing cycle. These query counts include all the domains associated with your account.

You can dig deeper into this data in the Queries by Domain table, where you can see the query counts for each domain over a set period of time.

You can also compare activity between domains in an interactive bar chart.

This is a great way to quickly see which domains are receiving the most traffic and identify any deviations from normal traffic patterns.

analytics DNS data graphQueries/Domain table and Chart

Domain Analytics

You will first see a quick overview of recent query activity for that domain over the current billing cycle. The time-series displays total query counts at 30 minute intervals.

Our interactive map displays query counts for each location represented as circles that grow/shrink relative to the query counts in other locations. Each location represents a point of presence (PoP) in the DNS Made Easy network. By hovering over the circle you can see the total queries for that location/PoP.

Click on a domain in the Queries by Domain table to access more granular data for that specific domain.

Global DNS animated image

Troubleshoot influx of DNS queries
 Examine request loads on DNS servers and zones
Evaluate effects of service or configuration changes

Compare queries at each location by selecting the checkbox next to the location name in the table. Filter the Queries by Location time-series at the bottom of the page to only show those locations you want to see.

The Queries by Location time-series shows query counts at each location at 30 minute intervals over a definable time range.

Based on account type you will have access from 45 to 62 days of data. All users have the ability to see query counts for each 30 minute period.

animated domain analytics

Gather insight into your DNS infrastructure
Analyze DDoS and other DNS-based attacks
Pinpoint which records are being used the most
Identify users over IPv6

Query Logging

This feature allows you to see your domain's live query traffic through one of our points of presence. Watch queries in real time on an interactive map or in raw tabular form.

Record name
Source address
EDNS client
IP version
Record type
ISO country
City

Query logs can be saved and reuploaded later for historical comparison.

DNS Analytics Live

 Identify system misconfigurations
 Compare capacity trends over time to detect attacks
 Identify stale or unused records
 Pinpoint a CDN (or other cloud service) that is making excess requests

Real-Time Stats | Record Usage

Real time DNS statistics

Real-Time Stats (RTS) is the first of its kind in the industry, offering unprecedented visibility into DNS record usage. The DNS Analytics platform shows you who is querying your domains, but our RTS tool shows you how your DNS resources are being used.

We recommend using RTS as a tool to review your query usage. If you keep going over your query quota, you can use RTS to identify which records are being used the most and even pinpoint system misconfigurations.

You can use RTS to filter your domain's query traffic by:
Record name
Record type
Location
IP protocol or version

Want a Proof of Concept?

Start Free Trial